Qlik Sense
Exploring the Collaboration and Writeback functionality in Vizlib
The final webinar in our series with Vizlib took place on 15th April. This time we took a closer look at the Collaboration and Writeback Vizlib products for Qlik Sense.
>> Read the summary
Taking a closer look at the Self-Service and Finance Vizlib extensions
The second in our webinar series with Vizlib took place on 25th March. This time we looked at the benefits that the Self-Service and Finance Vizlib extensions can bring to your Qlik Sense applications.
>> Read the summary
Improving data reporting for Babcock and the British Army
Customer Success Story – How we helped Babcock to improve its data reporting for the British army with Qlik and Microsoft.
>> Read more!
Turning Insights to Action with Vizlib extensions
We’re big fans of Vizlib extensions because they add immediate value to Qlik Sense with advanced capabilities, functionality and new chart types. Everything is customisable as you can control every setting and integrate it with your brand or interface with no coding required. If you didn’t catch the first webinar if our series exploring Vizlib value-added extensions, here’s a run-down of what you missed.
>> Read more
AMS modernised its analytics by moving from QlikView to Qlik Sense
Advanced Medical Solutions modernised its analytics by moving from QlikView to Qlik Sense. Its Qlik Sense app is now a business critical reporting tool and the single source of all its sales, budget and forecast data.
>> Read more!
Vizlib From Insights to Action
Data and analytics are playing a critical role in business and finance. One of the most prominent challenges organizations are facing today is the fragmented analytics landscape that makes it difficult for departments to share data and collaborate on data insights to be able to act fast and drive business value. In this webinar series, we will explore the immense potential of collaborating within Qlik Sense, leveraging visual planning to align strategy with operational performance with the help of Vizlib value-added products.
>> Sign up here!
Acutus Consulting merges with Climber
On 1st September 2020 Acutus Consulting became part of Climber UK. Acutus Consulting Ltd will become a subsidiary of Climber BI Ltd and the founder James Sharp has been appointed as Managing Director for Climber UK.
>> Learn more about the news here!
Maximise BI value and increase data literacy with the Qlik Usage Monitoring Application
Only 51 % use their Qlik solution on a daily basis, even though 63 % believe that it’s a business critical solution. Providing data is obviously not enough to get your employees on board, and no guarantee that people will actually use BI. So, how do you increase employee engagement?
>> Data literacy is key
Data visualization: choose the right visualization with the help of Qlik
Companies collect a lot of data. Just think of all the information you gather through your website, customer data, geo data, sales data, and so on. In this world of “data madness” we all want to gain important insights in no time. More and more companies are therefore using data visualization in business intelligence tools such as Qlik.
>> How do you choose the optimal visualization to answer your question?
Missing data? Survive Survivorship Bias with Qlik
How come some airplanes don’t return from the battlefield? Are the success stories of Bill Gates, Jeff Bezos and Mark Zuckerberg the best learning experiences? And how could people in 1987 think that cats were more likely to survive if they fell from a higher floor? All these questions have one factor in common: they suffer from “survivorship bias”.
>> What is Survivorship Bias?
Vizlib acquires Climber Extensions
Vizlib, the data visualisation library for Qlik Sense, has today announced the acquisition of Climber Extensions. Providing a range of complementary extensions for Qlik Sense, the spin-off of Climber AB will support Vizlib’s vision of making data talk.
>> Read the announcement
Webinar: Data Literacy crash course with Qlik’s Jordan Morrow
Don’t let data illiteracy hold back on your business performance! Find out how to kick start your journey towards greater data literacy in your organization by joining our 30-minute crash course webinar with Jordan Morrow, Head of Data Literacy, at Qlik.
>> Sign up here!
The Climber Custom Report Extension is TED accredited!
We are very happy to announce that the Climber Custom Report Extension – the quintessence of self-service – for Qlik Sense has been accredited within the Trusted Extension Developer Program. The TED program, that Qlik released a few months ago, enables developers to create innovative extensions that expand the value of Qlik Sense.
>> Read the announcement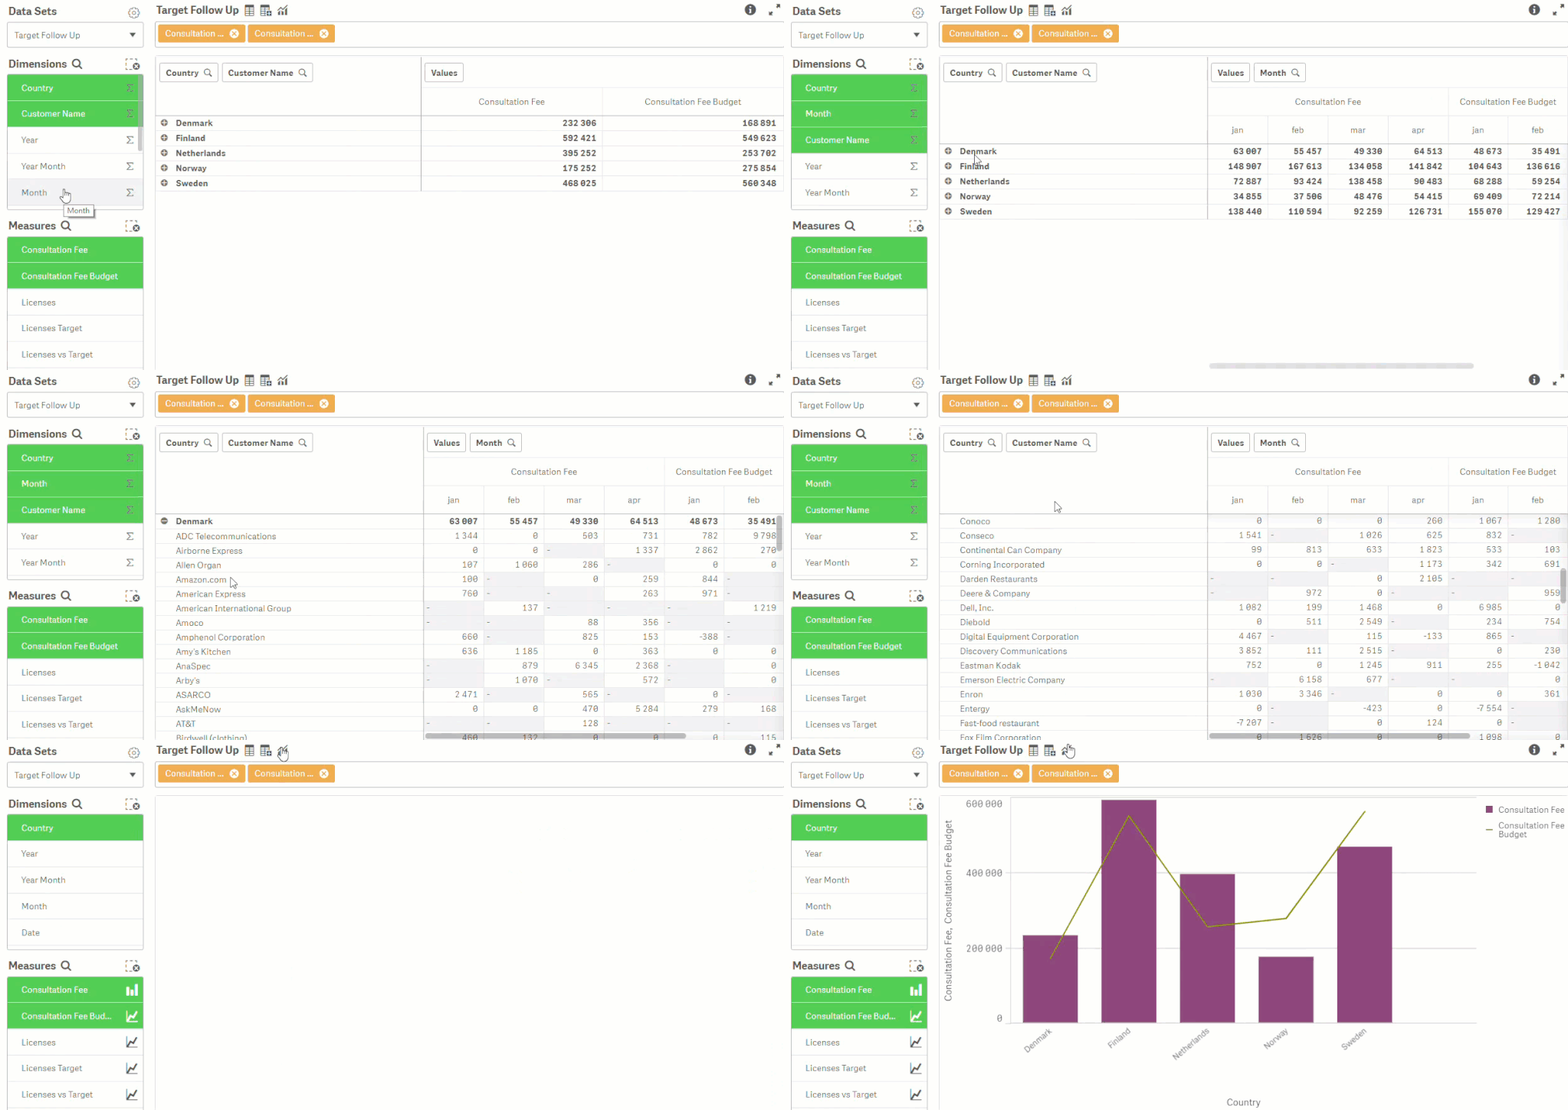
Have you seen the Climber Custom Report for Qlik Sense?
The Custom Report Extension for Qlik Sense is the quintessence of self-service, being able to create customized tables based on data in master tables gives you an extremely versatile and powerful tool. Choose any dimension or measure you want to see and visualize in a variety of ways.
>> Check out the tutorial!
Qlik launches Trusted Extension Developer Program
Qlik today announced the debut of its Trusted Extension Developer (TED) Program, which will enable developers to more easily create and deliver innovative visual extensions into commercial production environments.
>> Read the announcement
