



Six months of Microsoft Power BI
Written by: Scott Davies, BI Consultant at Climber
The updates we’re most excited about
Microsoft Power BI has had a busy summer and autumn. Monthly updates landed everything from a brand-new Gantt chart to some significant behind-the-scenes updates to chart formatting. Of course, many people are excited about Fabric Apps and using AI to deliver reporting solutions.
But let’s face it, Power BI is still the foundational BI tool for many companies out there and that’s going to be the case for some time to come! Let’s dive into some of the impactful changes that have happened in the last six months.
1. Gantt charts have (finally) arrived
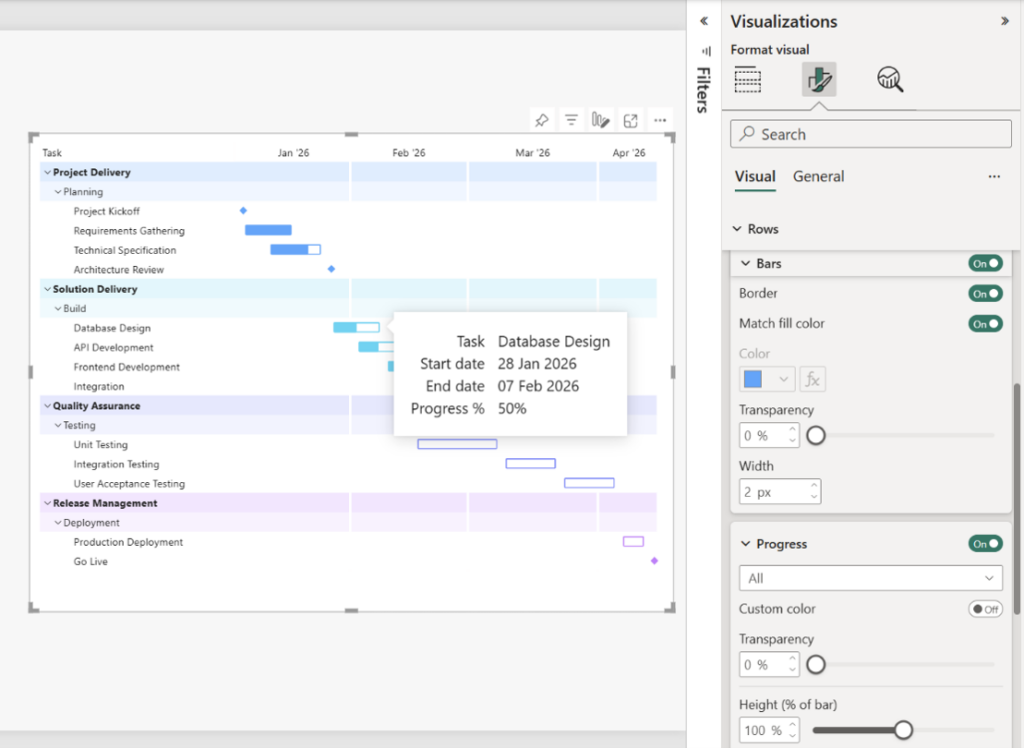
The lack of a Gantt chart in Power BI has been a serious bugbear for years! YouTube has dozens of workarounds for solving this requirement, so the arrival of a native Gantt Chart solution in October 2026 (currently in preview) has been warmly received!
The new visual shows task durations, progress, and milestones along a time axis, and you can:
- Set the axis range to focus on the period that matters
- Colour tasks by category
- Add extra task columns alongside the bars (owner, status, that sort of thing)
- Use a zoom axis to dive into a busy week without losing the bigger picture
Try it: In Power BI Desktop, go to File > Options and settings > Options > Preview features. Switch on the Gantt chart, and restart Desktop. PMOs, delivery leads, and anyone who’s ever been asked “so when will it be done?” – this will bring a smile to your face!
2. Chart settings got a serious health boost
It’s great to see some significant improvements to how charts can be formatted. A run of small formatting improvements over the last few months adds up to charts that look far more polished with far less fiddling.
- Plot area background colour (October, GA): Bar, column, line, area, combo, ribbon, waterfall, and scatter charts can now have a solid fill behind the plot. You can conditionally format it from a measure or field. Imagine for example a gentle red wash when a KPI is off-track.
- Outer padding (August): Control the space between the edge of the plot and your first and last categories on bar, column, line, ribbon, and waterfall charts. Set it and the category spacing to 0% and your bars will fill the whole area, edge to edge.
- A centre value for donut charts (August): No more layering a card on top of a donut and hoping nobody nudges it. The value in the middle now updates as people filter, cross-highlight and drill.
- Conditional formatting for line charts and legends (July): Lines can now take gradient colours or a consistent colour driven by a DAX measure. This is great for surfacing status at a glance.
- Tidier axes (June): Bar and column charts round their axis ranges sensibly and keep them steady when data labels are switched on. Scatter charts keep markers visible near the edges of the plot.
- Auto-expanding hierarchy axes (October, GA): Bar, column, and line charts can now expand hierarchy axes automatically when you select several columns, including via field parameters. Report viewers can thereby swap the axis themselves.
3. An update to Power Query
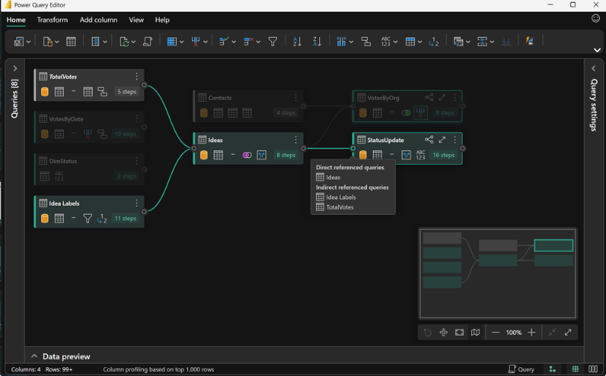
For anyone who’s used to the online interface for Fabric Dataflow Gen2, the Power Query experience in Power BI Desktop has felt a little outdated. Starting in May, and then again in September 2026, several updates were made available in the new Desktop Power Query Editor (in preview).
- Modern Get Data: This looks the same as the one that’s been available in Microsoft Fabric for some time. You also now get the option of a dark theme to suit your preference.
- Query folding: Now, the new interface clearly shows whether the step folds back to source. This, along with a new query plan which shows how the engine will run your query, makes it’s easier than ever to optimise your data queries.
- Diagram view: A visual map of the queries and how they reference or merge with one another.
- New features: Rank column, cluster values, query script view, and various upgrades to transforms.
Try it: To enable the feature, go to File > Options and settings > Options > Preview features, tick New Power Query experience, then select Transform data. The one setting turns on both the new Get Data screen and the new editor. If something isn’t quite ready for your workflow yet, just untick the box to go back to the classic editor.
4. A fresh, modern look out of the box
August brought modern visual defaults to general availability. New reports now start with the Fluent 2 base theme, and a new Theme pane lets you set palettes, text styles, and visual and page defaults in one place. Then, export your theme to share with the rest of the team. If you’ve ever spent the first half-hour of a new report fixing fonts, you’ll appreciate this. One of the things I really appreciate is the default page size is now 1920×1080, which is more suited to modern screens.
5. Improved slicers – functionally and aesthetically
Slicers have quietly had one of the best six months of any feature:
- Date picker for slicers: Relative dates, a calendar, and a slider. Plus a new single-date option. It arrived in preview in June and reached general availability in August. Great to see a feature move from preview to general availability in weeks, not months or years!
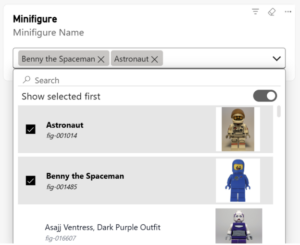
- Dropdown list slicers (October, preview): List slicers can now work as a dropdown, with selections shown as tidy little pills you can dismiss. There’s also a handy Show selected first option that pins active selections to the top.
- Numeric input slicers (May, GA): Type things like >2 or 1-2 straight into an input slicer.
- More styling options (June and August): Selection icon colours, rounded dropdown corners, accent bars, and coloured expand/collapse icons for hierarchy slicers.
6. Tables and matrices: the small things that matter
Tables and matrices are one of the most used visualisations. These enhancements are most welcome:
- Visual calculations and custom totals are generally available (May): Running totals, moving averages, and percent-of-parent without writing a single DAX measure. Plus None and Average as total options.
- Fixed column widths (May): Set exact pixel widths, and (from June) even drive them with DAX rules. Hallelujah! No more fiddling around trying to get your column widths to be precisely 50px wide or ensure all the columns are the same width one by painstaking one.
- Expand and collapse column headers (August): Matrix column headers now get the same +/- treatment rows have always had.
- Personal bookmarks remember your columns (October): Resize or reorder columns, save a personal bookmark, and the layout comes back exactly as you left it.
7. Copilot and AI keep getting more useful
No round-up in 2026 would be complete without an AI section. The highlights:
- Copilot summary shortcuts (May): A Summarize button on the report ribbon and a Copilot option right on the visual header. Getting a quick narrative now takes one click.
- Copilot in web modelling (June, preview): Ask for help with renames, relationships, and DAX measures in plain English.
- Power BI Desktop Bridge (June, preview): Lets AI agents and tools work with a running Desktop session to author and check reports.
- Agent-built reports with custom visuals (October, GA): The Power BI Report skill can now add supported custom visual, bind them to your data, and format them for you.
September’s update also leaned heavily into agentic experiences and bringing Power BI data into Microsoft 365 Copilot. A clear sign of where things are heading.
8. The quick-fire round
A few more improvements that are worth knowing about:
- Shape map is generally available, with built-in maps and your own TopoJSON/GeoJSON files (June)
- Azure Maps now reloads points beyond the initial limit when you filter, and zooms to fit (August)
- Export to Excel from the mobile app on iOS and Android (August)
- Comments in org apps, complete with @mentions (August)
- TMDL view on the web, for scripting model changes in the browser (July)
- DAX user-defined functions are generally available (June)
- Mobile-ready page indicator so you can see at a glance which pages have a mobile layout (October)
- Power BI tabs in Teams now show the item name, last refresh time, and sensitivity label (October)
Now is the time to update
If anyone in your team is still running an older copy of Power BI Desktop, do not wait to update. From October, Desktop versions from March 2026 or earlier can no longer save and share files to OneDrive and SharePoint. Of course you will be missing out on these great new features!
Credit where credit is due
It’s been a genuinely good six months for Power BI. The Gantt chart grabs the headlines, but it’s the steady stream of formatting, slicer, and table improvements that will quietly save you time every single week. Our advice? Update Desktop, switch on a couple of preview features, and have a play. We love the new features and we think you will too.
SUBSCRIBE
Want to stay up to date with the latest features in Microsoft Fabric and Power BI?
Subscribe to our blog and get monthly updates directly to your inbox.
WANT TO KNOW MORE? CONTACT US!
Scott Davies
BI Consultant & Training Manager
scott.davies@climberbi.co.uk
+44 203 858 0668
Gareth Wilson
BI Manager
gareth.wilson@climberbi.co.uk
+44 203 858 0668
News archive

Six months of Microsoft Power BI
Monthly updates have landed everything from a brand-new Gantt chart to some significant behind-the-scenes updates to chart formatting. Let’s dive into some of the impactful changes that have happened in the last six months.
>> Read more
What’s New in Qlik Cloud – November 2026
This month’s headline is the arrival of semantic models in data products, helping keep business definitions consistent. Read on for a closer look at all updates and what they mean for your team.
>> Read more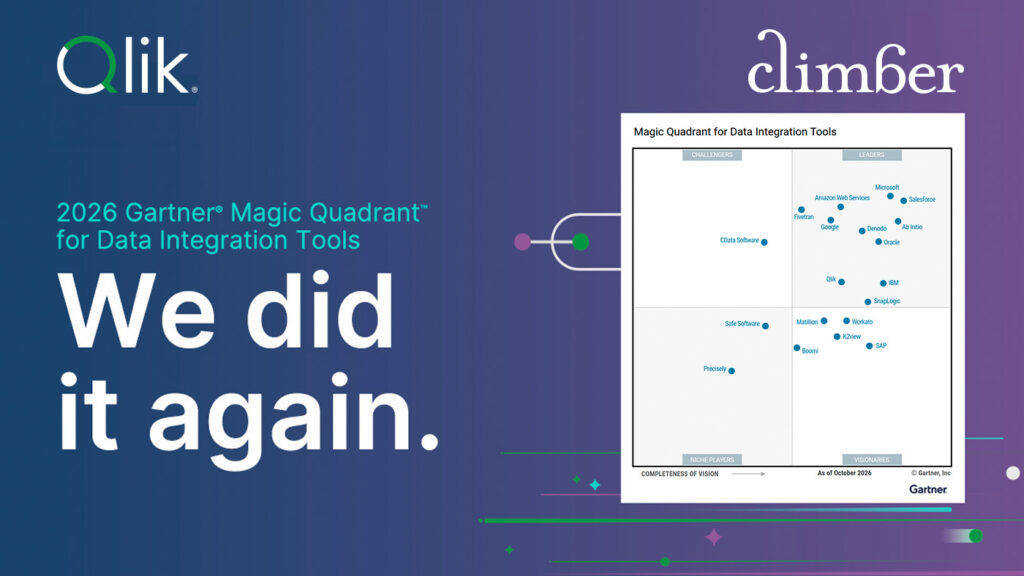
Qlik a Leader in the 2026 Gartner Magic Quadrant for Data Integration Tools
Unsure of how to evaluate the best solution for your needs? Get your free copy of the 2026 Gartner Magic Quadrant report for Data Integration and see why Qlik has been named a Leader for the eleventh time in a row.
>> Download the report