Blog

Qlik expands its capabilities within Predictive Analytics
Qlik has announced the acquisition of Big Squid, a machine learning platform provider offering no-code automated Machine Learning. Read Climber’s BI Manager Daniel Häggroth’s reflections about the acquisition and the future for AI and Predictive Analytics.
>> READ BLOG
7 reasons BI projects fail – and how to stop yours doing the same
During the coronavirus pandemic business intelligence and data analytics has shown its worth, as the businesses that have responded best to the immense challenges have had accurate data to rely on. Before your business rushes into implementing your own BI solution, take a look at some of the reasons BI projects fail, so you can be sure that yours doesn’t do the same.
>> Read more
The New Normal for Climber UK
Last week I brought the UK team together to meet face-to-face for the first time since the pandemic began. After a year of speaking on Microsoft Teams it was great to be together in person and reflect on what we have all achieved. Like many businesses we’ve been looking at what the ‘New Normal’ will look like for us post-pandemic.
>> Read more
Exploring the Collaboration and Writeback functionality in Vizlib
The final webinar in our series with Vizlib took place on 15th April. This time we took a closer look at the Collaboration and Writeback Vizlib products for Qlik Sense.
>> Read the summary
Taking a closer look at the Self-Service and Finance Vizlib extensions
The second in our webinar series with Vizlib took place on 25th March. This time we looked at the benefits that the Self-Service and Finance Vizlib extensions can bring to your Qlik Sense applications.
>> Read the summary
Turning Insights to Action with Vizlib extensions
We’re big fans of Vizlib extensions because they add immediate value to Qlik Sense with advanced capabilities, functionality and new chart types. Everything is customisable as you can control every setting and integrate it with your brand or interface with no coding required. If you didn’t catch the first webinar if our series exploring Vizlib value-added extensions, here’s a run-down of what you missed.
>> Read more
Maximise BI value and increase data literacy with the Qlik Usage Monitoring Application
Only 51 % use their Qlik solution on a daily basis, even though 63 % believe that it’s a business critical solution. Providing data is obviously not enough to get your employees on board, and no guarantee that people will actually use BI. So, how do you increase employee engagement?
>> Data literacy is key
Data visualization: choose the right visualization with the help of Qlik
Companies collect a lot of data. Just think of all the information you gather through your website, customer data, geo data, sales data, and so on. In this world of “data madness” we all want to gain important insights in no time. More and more companies are therefore using data visualization in business intelligence tools such as Qlik.
>> How do you choose the optimal visualization to answer your question?
Missing data? Survive Survivorship Bias with Qlik
How come some airplanes don’t return from the battlefield? Are the success stories of Bill Gates, Jeff Bezos and Mark Zuckerberg the best learning experiences? And how could people in 1987 think that cats were more likely to survive if they fell from a higher floor? All these questions have one factor in common: they suffer from “survivorship bias”.
>> What is Survivorship Bias?
Vizlib acquires Climber Extensions
Vizlib, the data visualisation library for Qlik Sense, has today announced the acquisition of Climber Extensions. Providing a range of complementary extensions for Qlik Sense, the spin-off of Climber AB will support Vizlib’s vision of making data talk.
>> Read the announcement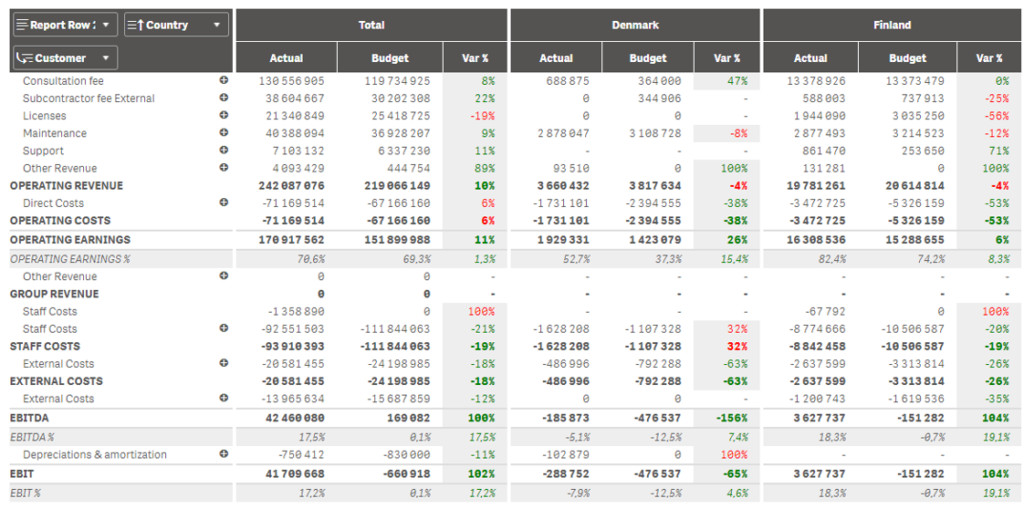
Check out our P&L Extension for Qlik Sense
Finally! Now you can add a P&L to your Qlik Sense solution using the Climber P&L Extension. In this tutorial, we will introduce you to our latest extension, one that makes it easier to connect strategy to your operations.
>> Learn more and watch the tutorial
